
International Research Journal of Engineering and Technology (IRJET) e-ISSN: 2395-0056
Volume: 07 Issue: 03 | Mar 2020 www.irjet.net p-ISSN: 2395-0072
© 2020, IRJET | Impact Factor value: 7.34 | ISO 9001:2008 Certified Journal | Page 803
FORECASTING STOCK MARKET MOVEMENT DIRECTION
USING SENTIMENT ANALYSIS AND SUPPORT VECTOR
MACHINE
SK. MUBEENA
1
, M. ANIL KUMAR
2
, U. RAMYA
3
, P. SUJATHA
4
1,2,3,4
B. Tech Students, Dept of CSE, Tirumala Engineering College, Narasaropet, Guntur, A.P., India
---------------------------------------------------------------------***----------------------------------------------------------------------
Abstract - Investor sentiment plays an important role on the stock market. User-generated textual content on the Internet
provides a precious source to reflect investor psychology and predicts stock prices as a complement to stock market data. This
paper integrates sentiment analysis into a machine learning method based on SVM. Furthermore, we take the day-of-week effect
into consideration and construct more reliable and realistic sentiment indexes. Empirical results illustrate that the accuracy of
forecasting the movement direction of the SSE 50 Index can be as high as 89.93% with a rise of 18.6% after introducing sentiment
variables. And, meanwhile, our model helps investors make wiser decisions. These findings also imply that sentiment probably
contains precious information about the asset fundamental values and can be regarded as one of the leading indicators of the stock
market.
Key Words: Support vector machine
1. INTRODUCTION:
F
ORECASTING stock market trends has been treated as one of the most challenging but important tasks. Stock market is a
nonlinear and dynamic system, and investor sentiment constitutes key factor of the financial market[1]. With the proliferation
of news, blogs, forums, and social networking websites, textual content on the Internet provides a precious source to reflect
investor sentiment and predicts stock prices as a complement to traditional stock market time series data. Hence an automated
approach is required to distill knowledge from alarge number of textual documents [2], [3]. Sentiment analysis is used to
automatically extract views, attitudes, and emotions from the opinionated contents [4]. So, we employ sentiment analysis to
construct sentiment indexes, and then aggregate them with stock market data to forecast movement direction.
1.1 RELATED WORK:
Sentiment Analysis in Finance Industry Sentiment is an opinion or feeling you have about something according to the Longman
Dictionary. Sentiment analysis is the method to transfer unstructured textual contents to structured data, and distill views,
attitudes, and emotions by language processing, data mining, and computational linguistics [11], [12]. Investor sentiment
constitutes a key factor of the financial market [1]. Baker and Wurgler [13] employ the equity share in new issues, the dividend
premium and some other variables as sentiment proxies, and point out that investor sentiment affects the cross section of stock
returns. Edmans et al. [14] use international soccer results as a mood variable and document a significant market decline after
each loss. Afterward, with the development of the sentiment analysis, researchers start to deal with written text that is a more
direct way to express ideas and emotions. Tetlock [15] generates a pessimistic media factor in terms of the Wall Street Journal’s
“Abreast of the Market” column and finds that high pessimism has a negative effect on market prices followed by a subsequent
reversion. Bollen et al. [16] present evidence that tweets posted on Twitter are a predictive factor of the Dow Jones Industrial
Average (DJIA) values and find an accuracy of 86.7% in predicting the daily up and down changes in the closing values of the
DJIA. Gillam et al. [17] concentrate on the volume of news to quantify the information incorporated in textual data and discover
that it enhances earnings forecasting. Moreover, sentiment analysis is superior to the bag-of-words model at individual stock,
sector, and index levels in predicting stock prices [12]. Oliveira et al. [18] propose an automated method to build a stock market
sentiment lexicon to facilitate the research in the area. Nevertheless, the day-of-week effect is rarely mentioned in the study of
investor sentiment.
1.2 SVM in Predicting Stock Market
SVM was proposed by Vapnik [19] and is a supervised learning method that can partially address the overfitting problem
directly and formally [20]. With the help of kernel functions, such as radical basis function (RBF) kernel and polynomial kernel,
it is able to solve the nonlinear problem by projecting it onto the high-dimensional feature space
2. METHODOLOGY
International Research Journal of Engineering and Technology (IRJET) e-ISSN: 2395-0056
Volume: 07 Issue: 03 | Mar 2020 www.irjet.net p-ISSN: 2395-0072
© 2020, IRJET | Impact Factor value: 7.34 | ISO 9001:2008 Certified Journal | Page 804
This paper aims to forecast stock market movement direction by not only using financial market data, but also combining them
with sentiment features that incorporate investor psychology. The features are extracted from unstructured news data
automatically and then are expressed as sentiment indexes. In order to make the indexes more realistic and reliable, we take
the day-of-week effect into consideration. Next, we employ SVM to forecast stock market trends, and make an adjustment to
real market situations by use of a rolling window approach, and then compare the accuracy with the baseline method.
Moreover, the prediction results are used to instruct investment decisions, and the performance of three different trading
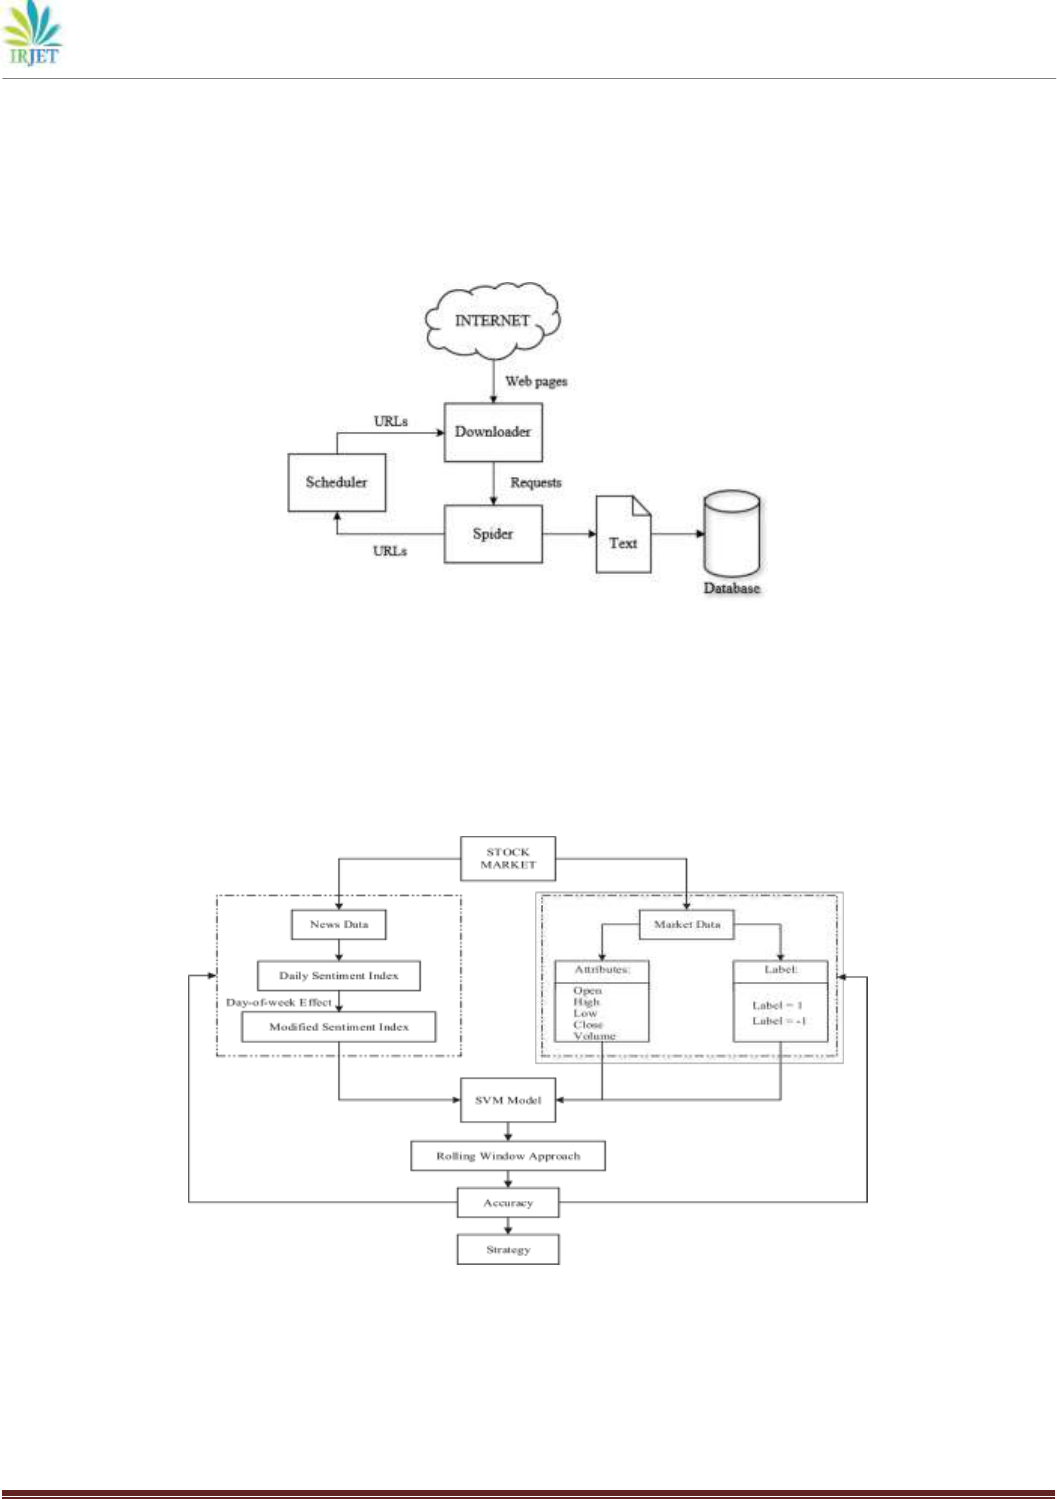
strategies are evaluated and compared. The overview of the stock market prediction architecture is illustrated in Fig. 1.
2.1. Investor Sentiment:
Step1 Web crawler In this step, we aim to build a web crawler to automatically download the targeted textual documents from
the Internet and store them to a database for further processing. The framework is clarified in Fig. 2. The web crawler begins
with the seeds in the form of a list of URLs. The scheduler manages the queue of URLs, deciding the priority and eliminating
duplicate parts. Next, the downloader is responsible for acquiring the web pages from the Internet and providing them to the
spider, which is used to parse the pages and extract the targeted contents. What we need to obtain is comprised of two sections:
one is the textual news with the date from the websites, and
This section is made up of three steps. We first build a web crawler to download news documents automatically from the
Internet, and then construct daily sentiment indexes based on
step 2: Sentiment calculation: we can compute 51 sentiment indexes for 51 stocks. In Step 2, we first segment each document
into several sentences by identifying punctuations, such as “,” “.” and “!” Then sentences are divided into separate words, and if
there appears a negative word, it is treated as a whole with the word next to it. For example, if people say “(I’m not satisfied
with the stock),” after word segmentation, the sentence becomes four words “(I’m)” “(not)” “(satisfied with)” “(the)” “(stock).” If

International Research Journal of Engineering and Technology (IRJET) e-ISSN: 2395-0056
Volume: 07 Issue: 03 | Mar 2020 www.irjet.net p-ISSN: 2395-0072
© 2020, IRJET | Impact Factor value: 7.34 | ISO 9001:2008 Certified Journal | Page 805
we directly project the words to the sentiment space, the program will tell us the sentence is optimistic because of the positive
word “(satisfied with).” So, we need to treat “(not)” “(satisfied with)” as a whole “(not satisfied with)” so that we can find the
true meaning. Then, we need to categorize each document, assume there are p
i
positive sentences and n
i
negative sentences in
document i; if p
i
> n
i
, the document is positive; if p
i
= n
i
, the document is neutral; if p
i
< n
i
, the document is negative. And, then we
find on the day t, the number of positive comments is M
t
bull
and the number of negative comments is M
t
bear
, so a daily sentiment
index is calculated by using formula (1), with the value ranging from –1 to 1, where 0 means people hold a neutral position.
And, if the value is between 0 and 1, it means people hold a positive view; if the value is between –1 and 0, it means people take
a negative view. Then, by considering the day-of-week effec
Step 3 Modified sentiment: The day-of-week effect is one of the most well-known financial anomalies [5], which means that the
average return on a Monday is much lower than that on the other days of the week. The reason includes that large amount of
news is reported on the weekend or on Friday just after the market is closed. With such considerable and valuable information
to deal with, investors are very likely to change their mind and take actions on Mondays. Furthermore, corporations also tend
to release important news on the weekend to ensure the stability of the stock and boost the public image. If it is bad news,
investors will have enough time to digest and accept it, whereas if it is good news, companies can continuously spread out news
to make it known by more and more people and expand their coverage.
TABLE II DESCRIPTION OF EIGHT FEATURES
Features
Description
s1
The average of modified sentiment
indexes
s2
The highest of modified sentiment
indexes
s3
The lowest of modified sentiment
indexes
s4
The median of modified sentiment
indexes
s5
The value between the highest and the
lowest
s6
The change of the average
s7
The percentage of the average change
s8
The standard deviation of modified
sentiment indexes
sentiment indexes, the median of modified sentiment indexes, the average of modified sentiment indexes, the difference
between the highest and the lowest, the change of the average (a certain day’s average minus the last day’s average), the
percentage of the average change (a certain day’s average minus the last day’s average and divided by the last day’s average),
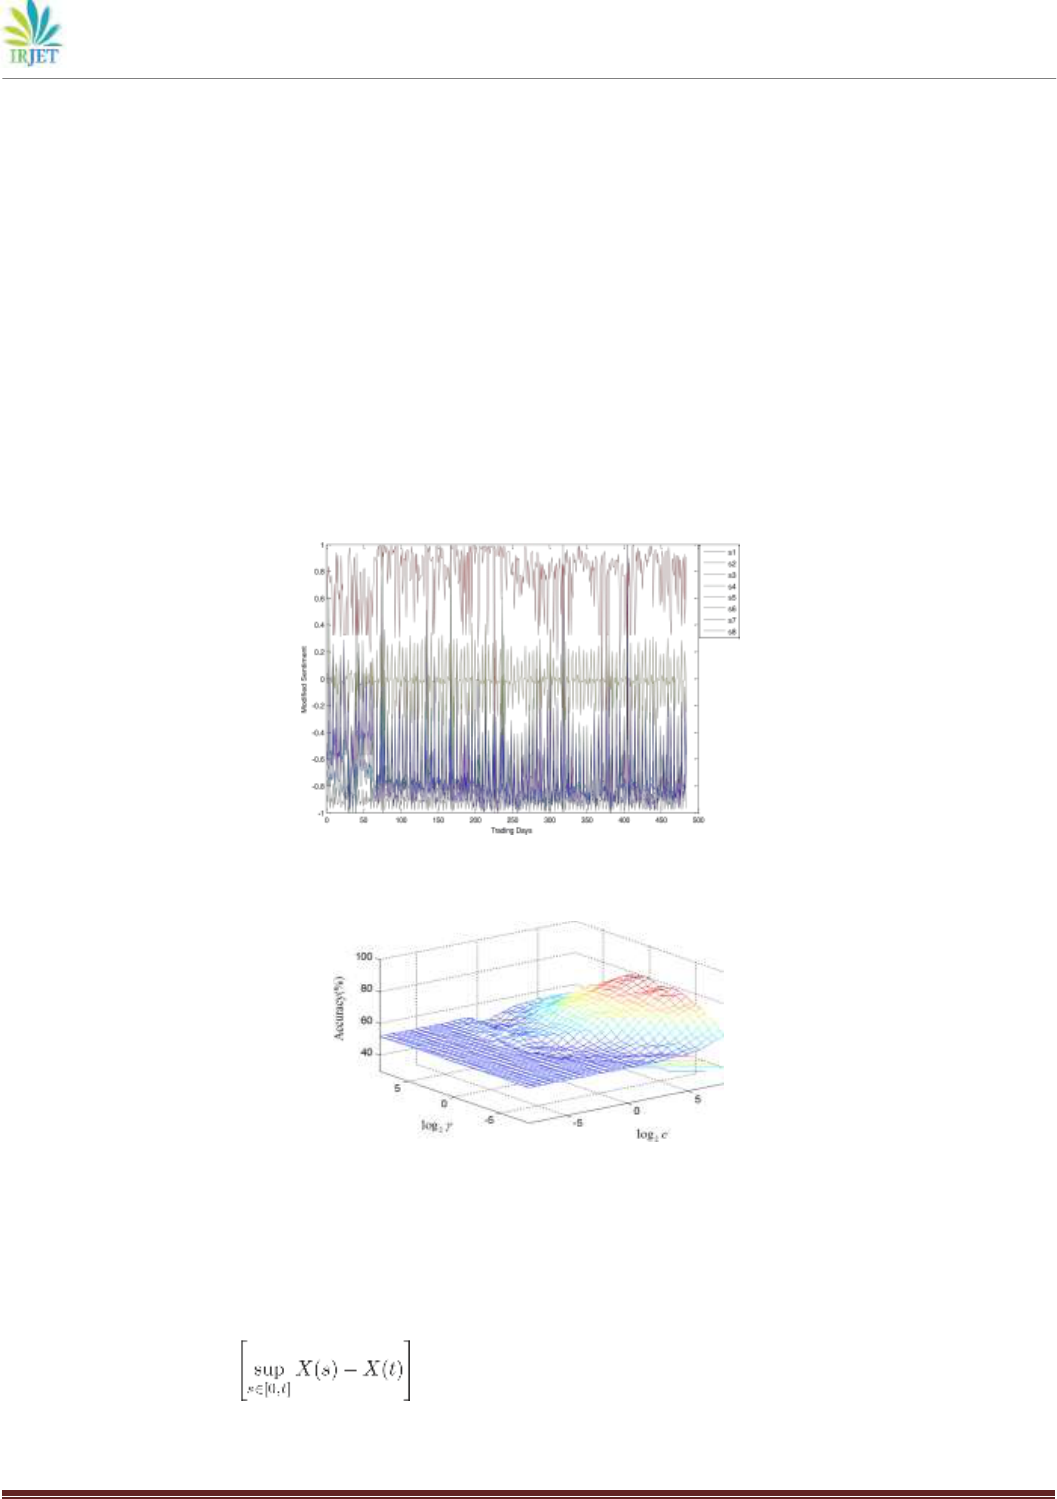
and the standard deviation of 51 modified sentiment indexes. Table II describes eight selected features. Fig. 3 sheds light on the
trend of the 8 variables after standardization in 484 trading days.
2.2 Prediction:
First, we need to label the data according to the following equation:
Label = 1, Close
t−
1 <Close
t (16)
−1, Close
t
−1 >Close
t
where Close
t
denotes the close price of the SSE 50 Index, and Close
t
−1 stands for the close price on the previous day. Besides, 1
also means buy order as it indicates the increase, whereas −1 means sell order as it implies the decline.
Next, we implement two experiments to predict the index movement direction. Experiment 1 is to use market data, which
include opening price, closing price, high for the day, low for the day, trading volume in number of shares, trading volume in
RMB, change in RMB, and change in percentage. And then, we combine them with sentiment features for Experiment 2. We
employ classification accuracy Acc to assess the performance, as shown in the following equation:
Acc = (17)
International Research Journal of Engineering and Technology (IRJET) e-ISSN: 2395-0056
Volume: 07 Issue: 03 | Mar 2020 www.irjet.net p-ISSN: 2395-0072
© 2020, IRJET | Impact Factor value: 7.34 | ISO 9001:2008 Certified Journal | Page 806
where T
++
denotes that the true value is +1 and the prediction value is also +1; T−−denotes that the true value is −1 and the
prediction value is also −1;F
+
−denotes that the true value is +1, whereas the prediction value is –1;F−+ denotes that the true
value is −1, whereas the prediction value is +1.
A fivefold cross-validation approach is adapted to train an SVM model. Eventually, we find the proper parameters and the
kernel functions to achieve the best performance. Figs. 4 and 5 document the processes of parameter selection. Panel A of Table
III sheds light on the prediction results. For Experiment 1, the accuracy can be 79.96%, and we use RBF kernel function, C =
256,γ = 0.9942; for Experiment 2, the accuracy can be as high as 97.73%, and we employ RBF kernel function, C = 181.0193,γ =
0.005524.
However, the two kinds of methods cannot be applied in forecasting stock market movement direction for the reason that they
lead to look-ahead bias, which is created by the use of information or data that would not have been known or available during
the period being analyzed. For example, we have some data from January to May, and implement the fivefold cross validation
approach. When we use the data from February to May as training set and the data in January as testing set, it is impossible
because in January, we will never know what will happen from February to May. On the other hand, that does not mean the
method is useless, and it is an important procedure to select the proper kernel functions and parameters as well as address the
overfitting problem. In other words, the purpose of the procedure is not to forecast but select the proper kernel functions and
parameters.
3. Sentiment features in trading days:
4. Investment Performance:
This section tries to discover if the prediction results are of benefit to the investment. Some measures are employed to evaluate
and compare the performance of the methods. AI is computed based on the stock points. For example, if we buy a stock at the
price of 100 and sell it at 150, then we earn 50 stock points and AI is 50 stock points; after that, we short the equity at 150 and
liquidate the position at 120, then we make 30 stock points and AI becomes 80 stock points. Maximum drawdown (MDD) is the
maximum decline of a series from a peak to a trough over a specified time period [26]. MDD at
time T is expressed as
MDD = sup(18)
t∈[0,T ]

International Research Journal of Engineering and Technology (IRJET) e-ISSN: 2395-0056
Volume: 07 Issue: 03 | Mar 2020 www.irjet.net p-ISSN: 2395-0072
© 2020, IRJET | Impact Factor value: 7.34 | ISO 9001:2008 Certified Journal | Page 807
5. CONCLUSION AND FUTURE WORK
In this paper, we aim to exploit investor sentiment to forecast stock market movement direction by emphasizing the role of
investors. Investor psychology drives the stock market [1] and it matters for our research. Accordingly, user-generated content
on the Internet provides a precious source to reflect investor psychology. Sentiment analysis is used to convert unstructured
textual documents into daily sentiment indexes. Furthermore, the financial anomaly day-of-week effect that means the average
return on Mondays is much lower than that on the other days of the week probably influences the precision of the sentiment
indexes, so we adjust the indexes by introducing an exponential function on past sentiment changes on weekends and then
generalize to holidays. Correspondingly, Sina Finance and Eastmoney, two typical financial websites, were selected as
experimental platforms to obtain a corpus of financial review data. Then, the machine learning model SVM is employed to
predict a very important index in China, the SSE 50 Index, by implementing fivefold cross validation and a realistic rolling
window approach. Empirical results illustrate that combining sentiment features with stock market data can achieve a much
better performance than just using stock
REFERENCES
1. R. J. Shiller, Irrational Exuberance. Princeton, NJ, USA: Princeton Univ. Press, 2000.
2. I. Perikos and I. Hatzilygeroudis, “Recognizing emotions in text using ensemble of classifiers,” Eng. Appl. Artif. Intell., vol.
51, pp. 191–201, 2016.
3. B. Wu, X. Zhou, Q. Jin, F. Lin, and H. Leung, “Analyzing social roles based on a hierarchical model and data mining for
collective decisionmaking support,” IEEE Syst. J., vol. 11, no. 1, pp. 356–365, Mar. 2017.
4. B.LiuandL.Zhang,“Asurveyofopinionminingandsentimentanalysis,” Mining Text Data. New York, NY, USA: Springer, 2012.
5. R. J. Shiller, “From efficient markets theory to behavioral finance,” J. Econ. Perspectives, vol. 17, no. 1, pp. 83–104, 2003.
6. F. C. Kelly, Why You Win or Lose: The Psychology of Speculation. North Chelmsford, Massachusetts, USA: Courier Corp.,
2003.
7. E. D. Maberly, “Eureka! Eureka! Discovery of the monday effect belongs to the ancient scribes,” Financial Anal. J., vol. 51, pp.
10–11, 1995.
8. J. Zhang, Y. Lai, and J. Lin, “The day-of-the-week effects of stock markets in different countries,” Finance Res. Lett., vol. 20,
pp. 47–62, 2017.
9. W.Huang,Y.Nakamori,andS.-Y.Wang,“Forecastingstockmarketmovement direction with support vector machine,” Comput.
Oper. Res., vol. 32, no. 10, pp. 2513–2522, 2005.
10. L. Yu, H. Chen, S. Wang, and K. K. Lai, “Evolving least squares support vector machines for stock market trend mining,” IEEE
Trans. Evol. Comput., vol. 13, no. 1, pp. 87–102, 2009.
11. C. C. Aggarwal and C. Zhai, Mining Text Data. New York, NY, USA: Springer, 2012.
12. X. Li, H. Xie, L. Chen, J. Wang, and X. Deng, “News impact on stock price return via sentiment analysis,” Knowl.-Based Syst.,
vol. 69, pp. 14–23, 2014.
13. M. Baker and J. Wurgler, “Investor sentiment and the cross-section of stock returns,” J. Finance, vol. 61, no. 4, pp. 1645–
1680, 2006.

International Research Journal of Engineering and Technology (IRJET) e-ISSN: 2395-0056
Volume: 07 Issue: 03 | Mar 2020 www.irjet.net p-ISSN: 2395-0072
© 2020, IRJET | Impact Factor value: 7.34 | ISO 9001:2008 Certified Journal | Page 808
14. A. Edmans, D. Garcia, and Ø. Norli, “Sports sentiment and stock returns,” J. Finance, vol. 62, no. 4, pp. 1967–1998, 2007.
15. P. C. Tetlock, “Giving content to investor sentiment: The role of media in the stock market,” J. Finance, vol. 62, no. 3, pp.
1139–1168, 2007.
16. J. Bollen, H. Mao, and X. Zeng, “Twitter mood predicts the stock market,” J. Comput. Sci., vol. 2, no. 1, pp. 1–8, 2011.
17. R. A. Gillam, J. B. Guerard, and R. Cahan, “News volume information: Beyond earnings forecasting in a global stock selection
model,” Int. J. Forecast., vol. 31, no. 2, pp. 575–581, 2015.
18. N. Oliveira, P. Cortez, and N. Areal, “Stock market sentiment lexicon acquisition using microblogging data and statistical
measures,” Decis. Support Syst., vol. 85, pp. 62–73, 2016.
19. V. Vapnik, The Nature of Statistical Learning Theory. New York, NY, USA: Springer, 2013.
20. M. Cecchini, H. Aytug, G. J. Koehler, and P. Pathak, “Detecting management fraud in public companies,” Manage. Sci., vol. 56,
no. 7, pp. 1146–1160, 2010.
21. Y. Kara, M. A. Boyacioglu, and O. K. Baykan, “Predicting direction of¨ stock price index movement using artificial neural
networks and support vector machines: The sample of the Istanbul stock exchange,” Expert Syst. Appl., vol. 38, no. 5, pp.
5311–5319, 2011.
22. P.-F. Pai and C.-S. Lin, “A hybrid ARIMA and support vector machines model in stock price forecasting,” Omega, vol. 33, no.
6, pp. 497–505, 2005.
23. D. D. Wu, L. Zheng, and D. L. Olson, “A decision support approach for online stock forum sentiment analysis,” IEEE Trans.
Syst., Man, Cybern., Syst., vol. 44, no. 8, pp. 1077–1087, Aug. 2014.
24. Z. Dong, Q. Dong, and C. Hao, “HowNet and its computation of meaning,” in Proc. 23rd Int. Conf. Comput. Linguistics,
Demonstrations, 2010, pp. 53–56.
25. N. Barberis, R. Greenwood, L. Jin, and A. Shleifer, “X-CAPM: An extrapolative capital asset pricing model,” J. Financial Econ.,
vol. 115, no. 1, pp. 1–24, 2015.
26. M. Magdon-Ismail, A. F. Atiya, A. Pratap, and Y. S. Abu-Mostafa, “On the maximum drawdown of a Brownian motion,” J. Appl.
Probab., vol. 41, no. 1, pp. 147–161, 2004.
27. W. F. Sharpe, “The sharpe ratio,” J. Portfolio Manage., vol. 21, no. 1, pp. 49–58, 1994.
28. V. Shukla, G. Auriol, and K. W. Hipel, “Multicriteria decision-making methodology for systems engineering,” IEEE Syst. J., vol.
10, no. 1, pp. 4–14, Mar. 2016.
